

Science


Recent Posts
Science
Expanse System at SDSC Helps Illustrate Way to Control Magnetism for Storage Solution
Controlling magnetism at the atomic level using electric fields may be used to create ultra-efficient electronic devices that perform faster and...
Science
Technology
Expanse Supercomputer Used to Analyze Unprecedented Number of Stars in Other Galaxies
A team of international scientists has embarked on a massive project to map the chemical history of our Milky Way galaxy and its neighbors using a...
Technology
Education
SDSC Participates in HPC Education Project to Produce New Cyber Training Catalog
SDSC's Mary Thomas has been participating in a U.S. multi-institutional initiative that streamlines discovery and collaboration through an...

Technology
Science
New AI Technology Aims to Revolutionize Fish Farming
To better understand how artificial intelligence can advance U.S. aquaculture development, a team of scientists will use a mobile camera mounted...

Technology
Education
SDSC's Rick Wagner Takes a Leading Role in Project Jupyter
Jupyter is a cornerstone of UC San Diego’s educational and research infrastructure, supporting tens of thousands of students annually across...

SDSC’s Christine Kirkpatrick Co-Authors Book on the Power of Consortia
Oxford University Press has just released The Consortia Century: Aligning for Impact, which examines how multi-stakeholder consortia are shaping...

Technology
Education
Awards
UC San Diego Leads $20M Grant to Provide Commercial Cloud Resources to National Research Community
CloudBank 2 will be a service-based resource, providing commercial cloud resources, from Jupyter Notebooks and secure data to the latest GPUs and...

Science
Expanse Supercomputer Used for Breakthrough Immunotherapy Study
A groundbreaking discovery published in Nature Immunology has shed light on why the immune system is less aggressive toward self-antigens, offering...

Science
Expanse Supercomputer Provides High-Res Mapping of Heat Risks in California’s Imperial Valley
Farmworkers in California’s Imperial Valley, who are on the frontlines of food production, are increasingly vulnerable to extreme heat. A new...
Technology
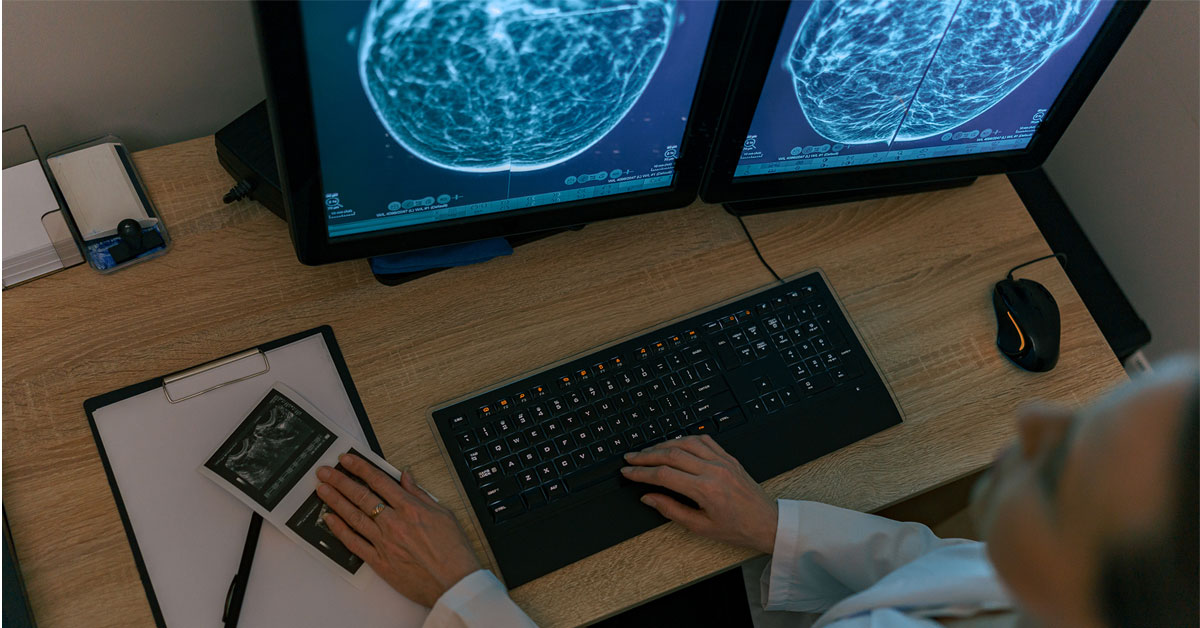
UC San Diego Team Develops New Dose Prediction Model for Breast Cancer Radiotherapy
Researchers at UC San Diego have developed advanced deep learning techniques that could revolutionize treatment planning for breast cancer...
Science
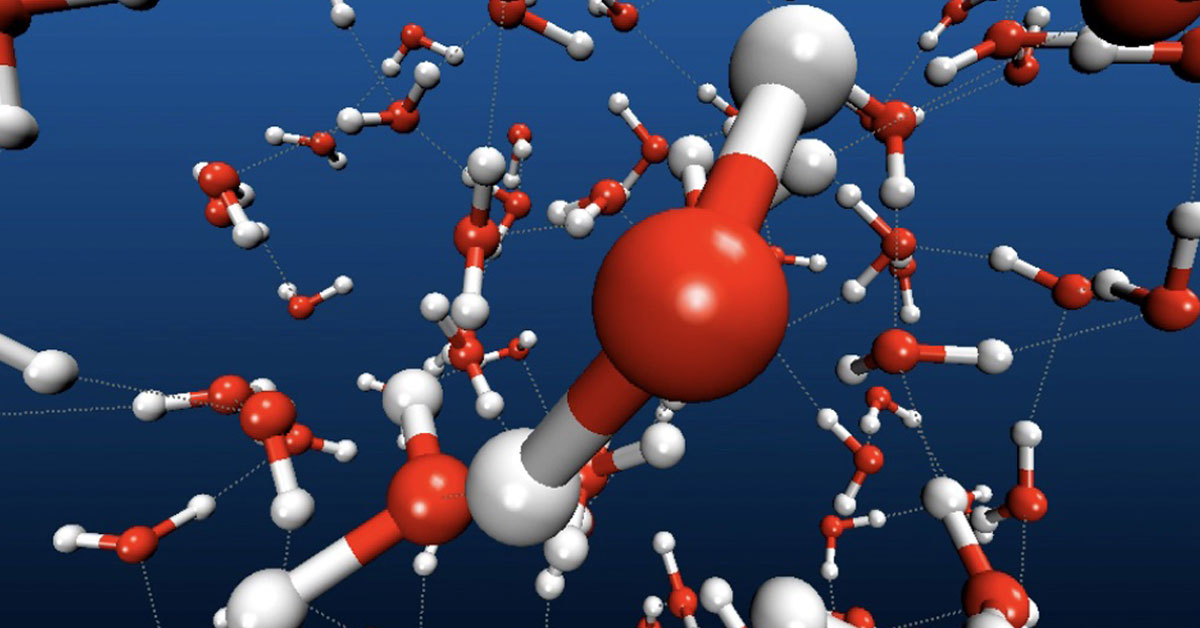
UC San Diego Team Uncovers Mystery of Water's Hidden Dual Phases
For decades, water’s behavior in extreme conditions has puzzled scientists. A study using SDSC's Expanse has produced compelling...

Technology
Science
Study Using Expanse Strengthens Earthquake Safety for Concrete-Filled Steel Deck Buildings
More than 30 years have passed since the 1994 Northridge earthquake, which exposed vulnerabilities in precast concrete structures. Since then,...

Technology
SDSC Leads Effort to Enhance National Research Data Management Ecosystem Infrastructure
Following international standards, the system provides a transparent and reliable way to centralize and preserve vital project...
Science
Education
Bioengineering Students in Washington Use Expanse to Learn Supercomputing
UW Professor Valerie Daggett has been using allocations to teach a computational protein design course to both undergraduate and graduate students.

Education
Technology
Academic and Industry Leaders Convene at 6NRP Workshop to Discuss the Next Generation of Open Research Infrastructure
NRP marked another impactful year of the platform helping researchers, domain scientists, network and system administrators, and industry leaders...
Education
Technology
Stack Science Contributes Innovative CI and Tech Expertise to Research and Teaching
SDSC has recently completed the merger of two of its established Centers of Excellence: Sherlock Regulated Data Management & Secure Cloud and...

Education
Technology
Science
Study Co-Led by Student Uses Expanse to Develop Biotech Algorithm that Could Speed Up Drug Research
Illinois Tech student and professor used the Expanse Supercomputer to develop patent-pending tech that could speed up drug research.
Education
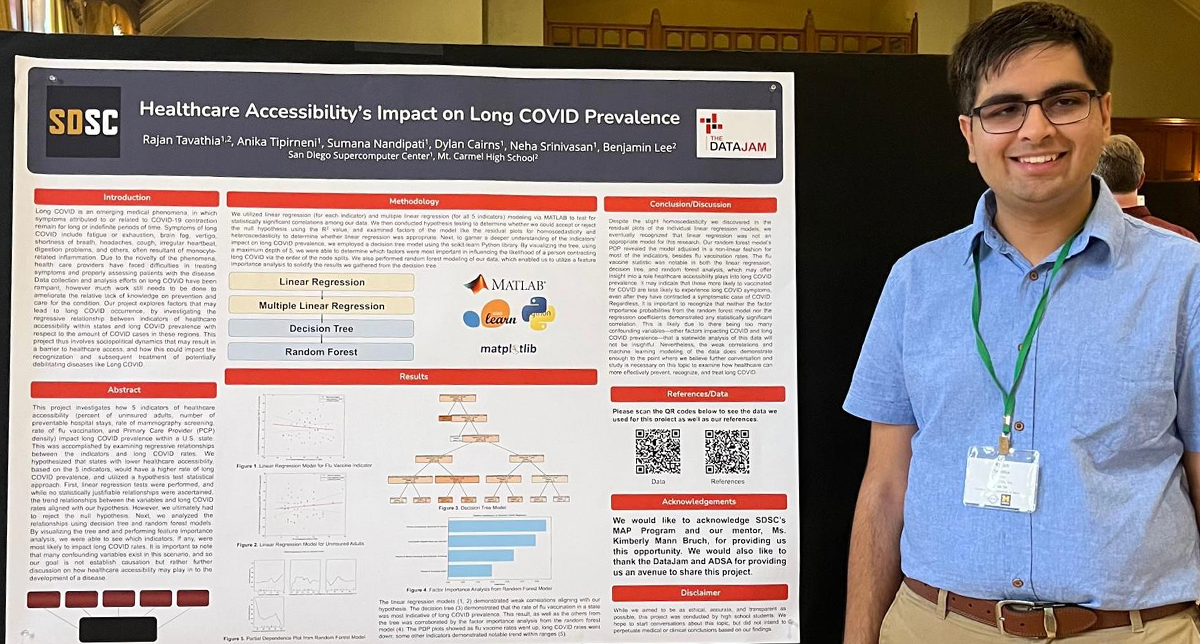
High School Intern at SDSC Presents Research Outcomes at National Data Science Meeting
Mt. Carmel High student’s collaborative study highlights complex factors of long COVID, sparks discussion about role of healthcare...

Technology
Awards
Researchers Awarded $3M NSF Grant for Next-Generation Forest Mapping and Monitoring
New OpenForest4D project will leverage AI and multi-source remote sensing data to facilitate transformative research in forest sciences and ecology.
Science
Technology
Education
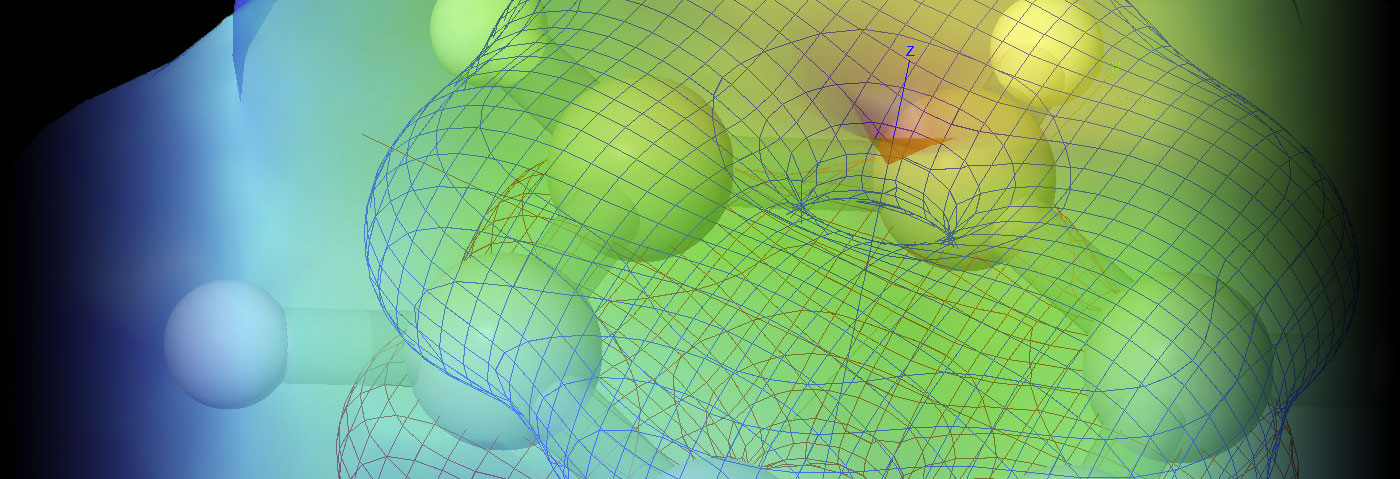
Expanse Supercomputer to Expand Training for Chemistry Faculty, Students Nationwide
ChemCompute, a free web-based platform powered by supercomputers including SDSC's Expanse, has enabled over 110,000 students to perform...
Science
Technology
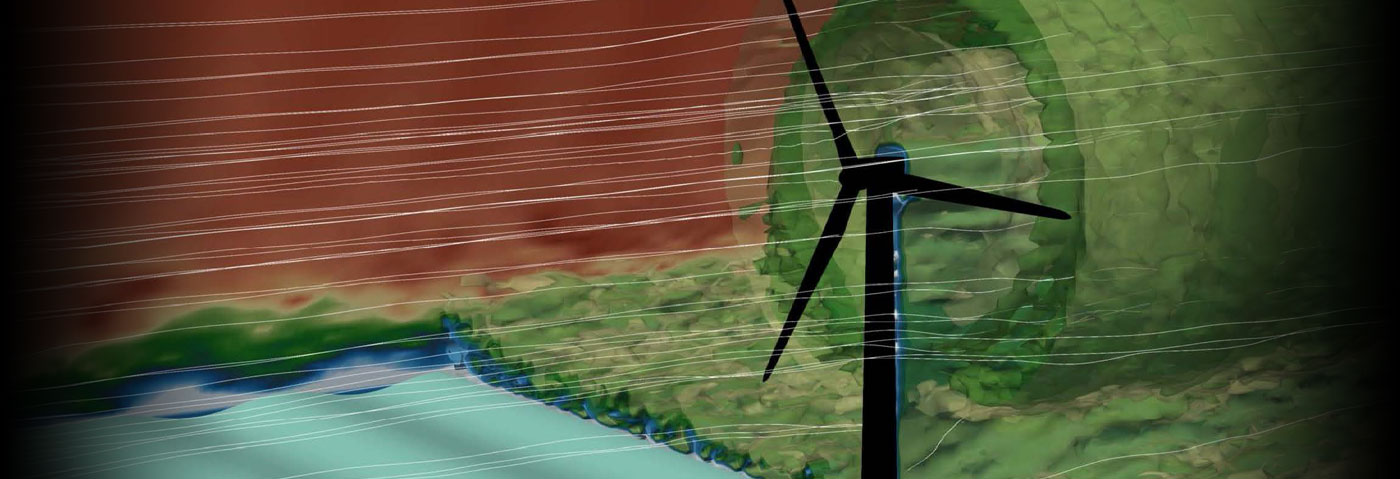
Supercomputer Sims Illustrate Impact of Ocean Waves on Offshore Wind Turbine Efficiency
New insights could help optimize power generation in ocean-based wind farms by revealing how different types of waves alter wind flows around...

Technology
Scientists Combine Immersive Technology and Collaboration to Address Climate Challenges
New initiative called “EcoViz” enables clear and compelling visualizations of environmental data from fire to floods.
Technology
Awards
San Diego Supercomputer Center Receives Honors in 2024 BigDATAwire Readers’ and Editors’ Choice Awards
The National Data Platform received the coveted award given to leaders in global data science, AI and advanced analytics.

Technology
Awards
San Diego Supercomputer Center Receives NSF Grant to Enable AI Research on NVIDIA DGX Cloud Resources
Grant benefits NAIRR Pilot researchers by enabling SDSC to create custom research environments using cloud platforms that drive innovation at an...
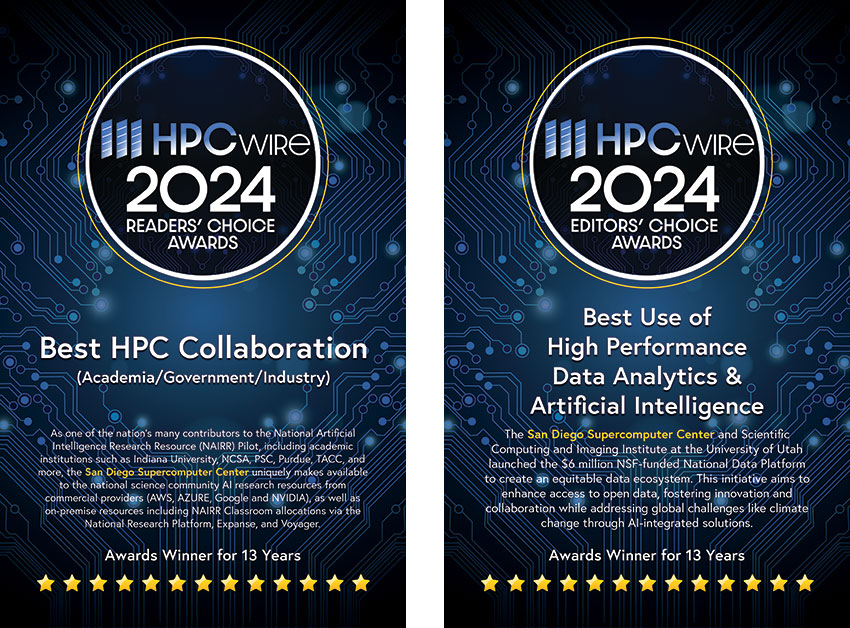
Awards
San Diego Supercomputer Center Receives Honors in 2024 HPCwire Readers’ and Editors’ Choice Awards
SDSC wins two HPCwire Awards at the 2024 International Conference for High Performance Computing, Networking, Storage, and Analysis (SC24), in...